7 ways to use a printable Gantt chart
The Gantt chart turns the calendar on its side. Instead of days as columns and each event as a small note inside them, you get events as horizontal bars stretching along a timeline. That sounds technical, but in practice it is the easiest way to see what happens when — and what overlaps what.
Here are seven places the Gantt template beats an ordinary calendar.
1. A project timeline
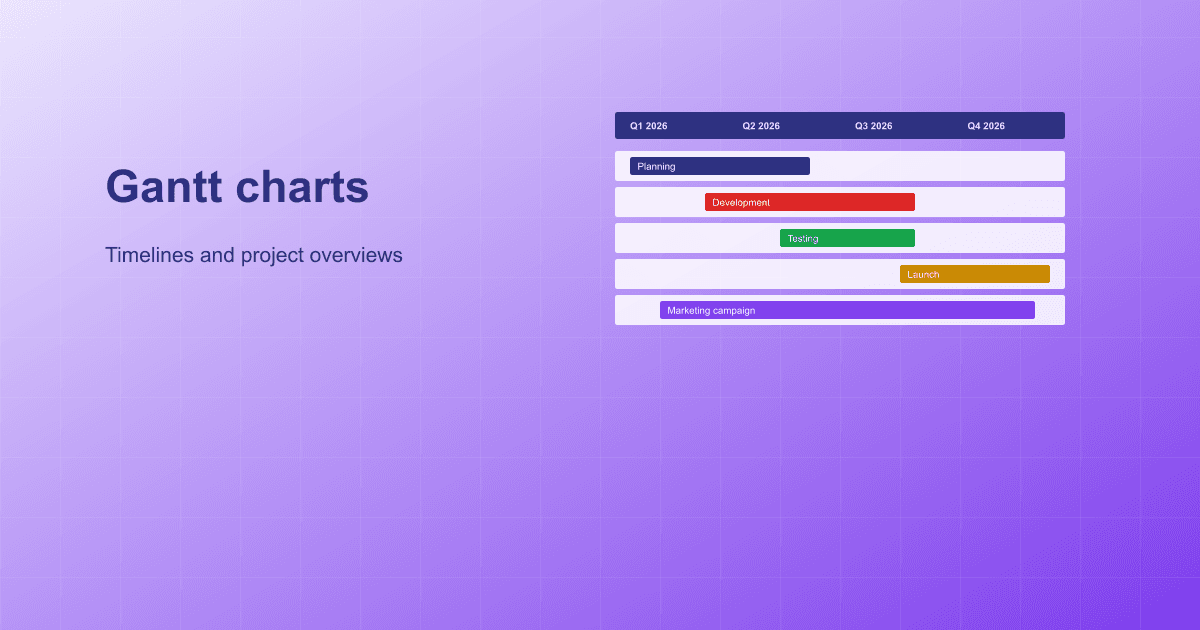
The classic use. Add the project's phases as date ranges — Planning, Development, Testing, Launch — and one glance tells you where you are, what overlaps, and where the critical milestones sit.
Tip: use drag and drop to reorder the rows so related phases sit next to each other. The grip handle on the left of each row lets you move it, and the printed chart follows the order you set.
2. A sprint overview for development teams
If your team runs two-week sprints, build a Gantt with:
- One bar per sprint (a date range, say 1–14 January)
- One bar per release milestone (a single date in a different color)
- Any code-freeze periods before a release, as date ranges
Print it in A3 and put it up in the team's area. It is much harder to forget a sprint boundary that is hanging on the wall.
3. Marketing campaigns
Campaigns are almost always several overlapping activities at once:
- Content production (date range — weeks 1–4)
- Social launch (date range — weeks 4–6)
- Email send (single date in week 5)
- Paid advertising (date range — weeks 5–8)
- Press release (single date in week 5)
The Gantt lets you check visually that it is all in sync: that the email lands the same day as the press release, that the ads do not start before the content is through production, and so on.
4. Construction and building projects
Self-builders, contractors, carpenters — anyone coordinating several trades that need to arrive in the right order. The Gantt shows where electrical meets plumbing meets bricklaying, and where the sequential dependencies sit (the foundation has to be done before anything goes up on it).
It does not replace real project-management software on a large site, but for a private build or a smaller renovation it is plenty — and the client gets a good-looking print they can keep in the kitchen and follow along with.
5. A book or product launch
Shipping something in Q3? The Gantt shows you the road to it:
- Writing the manuscript (a date range over three to six months)
- Editing (a date range overlapping the end of the writing)
- Proofreading (date range)
- Print and production (date range — critical for anything physical)
- Marketing build-up (date range, often six weeks before release)
- Launch day (single date, strong color)
Tip: fix the launch date and work backwards. The Gantt makes it visually obvious when your current deadlines do not add up — the bars push each other out past the launch date.
6. Weddings and event planning
A wedding is a project, just one with higher emotional stakes. The Gantt template handles:
- Bookings (date ranges up to the day — venue, photographer, DJ)
- Orders and purchases (dress, rings, flowers, cake)
- Invitations (date ranges — sending, RSVP deadline, chasing the stragglers)
- The day itself (a single date in a large, strong color)
- The honeymoon (a date range after)
It gives you a calm view of the next 9–12 months, and it catches the things that need acting on now, before they become urgent.
7. Personal goals over six months
For anyone who treats new year's resolutions realistically: build a Gantt with your three to five goals for the first half of the year. Each goal is a date range. Each checkpoint is a single date.
For example:
- Marathon training (date range — weeks 4–22) → Marathon (single date — week 22)
- Read 12 books (date range — January to June)
- Save a set amount (date range, with monthly checkpoints as single dates)
- Reach B1 in Spanish (date range, with the exam as a single date)
Print it in A4 portrait — it fits in a notebook, or on the fridge.
Getting the most out of the Gantt template
Use date ranges rather than single dates. That is the whole point. A single date is just a marker on the timeline; a date range is a bar that says "something is happening here, over time".
Color coding matters. The first preset (blue) is the default, but use different colors for different kinds of work — blue for production, green for testing, red for release. It is what makes the chart readable at first glance.
Drag to reorder. Once you have five or more events, group the related ones together. The grip handle on the left of each row is your friend. The order in the list is the order on the Y-axis.
Use bold or italic on the milestones that matter. In the event form you can mark something like a launch date as bold, so it stands out from the preparation around it.
Choose a sensible number of months. Three months with a handful of events looks empty; twelve months with a lot of events gets hard to read. Four to six months is usually the sweet spot for a project plan.
Ready to try it? Go to the designer, pick Gantt chart as your template, and start adding date ranges. If what you actually need is a general calendar for holidays and birthdays, have a look at our guide to the year-at-a-glance calendar.